Financial Performance
Shareholders Equity
Rs. in Million
Total Assets
Rs. in Million
Total Liabilities
Rs. in Million
Earnings per share
Operating Revenue
Rs. in Million
Break-up value per share
Profit after tax
Rs. in Million
Return on Equity
Financial Leverage Ratio
Return on Capital Employed
Interest cover ratio
Dividend pay-out ratio
|
Financial Reports
2026  3rd Quarter Report 2025-2026  2nd Quarter Report 2025-2026  1st Quarter Report 2025-2026 2025  Annual Report 2024-2025  3rd Quarter Report 2024-2025  2nd Quarter Report 2024-2025  1st Quarter Report 2024-2025 2024  Annual Report 2023-2024  3rd Quarter Report 2023-2024  2nd Quarter Report 2023-2024  1st Quarter Report 2023-2024 2023  Annual Report 2022-2023  3rd Quarter Report 2022-2023  2nd Quarter Report 2022-2023  1st Quarter Report 2022-2023 2022  Annual Report 2021-2022  3rd Quarter Report 2021-2022 2nd Quarter Report 2021-2022  1st Quarter Report 2021-2022 2021  Annual Report 2020-2021  3rd Quarter Report 2020-2021  2nd Quarter Report 2020-2021  1st Quarter Report 2020-2021 2020  Annual Report 2019-2020  3rd Quarter Report 2019-2020  2nd Quarter Report 2019-2020  1st Quarter Report 2019-2020 2019  Annual Report 2018-2019  3rd Quarter Report 2018-2019  2nd Quarter Report 2018-2019  1st Quarter Report 2018-2019 2018  Annual Report 2017-2018  3rd Quarter Report 2017-2018  2nd Quarter Report 2017-2018  1st Quarter Report 2017-2018 2017  Annual Report 2017 2016 - 2017  3rd Quarter Report 2016 - 2017  2nd Quarter Report 2016 - 2017  1st Quarter Report 2016 - 2017 2016  Annual Report 2016 2015 - 2016  3rd Quarter Report 2015 - 2016  2nd Quarter Report 2015 - 2016  1st Quarter Report 2015 - 2016 2015  Annual Report 2015 2014 - 2015  3rd Quarter Report 2014 - 2015  2nd Quarter Report 2014 - 2015  1st Quarter Report 2014 - 2015 2014  Annual Report 2014 2013 - 2014  3rd Quarter Report 2013 - 2014  2nd Quarter Report 2013 - 2014  1st Quarter Report 2013 - 2014 2013 Annual Report 2013 2012 - 2013 3rd Quarter Report 2012 - 2013 2nd Quarter Report 2012 - 2013  1st Quarter Report 2012 - 2013 2012  Annual Report 2011 - 2012  3rd Quarter 2011 - 2012  2nd Quarter 2011 - 2012  1st Quarter 2011 - 2012 2011  Annual Report 2010 - 2011  3rd Quarter 2010 - 2011  2nd Quarter 2010 - 2011  1st Quarter 2010 - 2011 2010  Annual Report 2009 - 2010  3rd Quarter 2009 - 2010  2nd Quarter 2009 - 2010  1st Quarter 2009 - 2010 2009  Annual Report 2008 - 2009 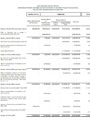 3rd Quarter 2008 - 2009 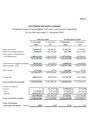 2nd Quarter 2008 - 2009  1st Quarter 2008 - 2009 2008  Annual Report 2007 - 2008  3rd Quarter 2007 - 2008  2nd Quarter 2007 - 2008  1st Quarter 2007 - 2008 2007  Annual Report 2006 - 2007  3rd Quarter 2006 - 2007  2nd Quarter 2006 - 2007  1st Quarter 2006 - 2007
|
|||||||||||||||||||||||||||||||||||||||||||||||||||||||||||||||||||||||||||||||||||||||||||||||||||||||||||||||||||||||||||||||||||||||||||||||||||||||||||